Interpreting Electrocardiography – By Dr. Gnana Sankaralingam
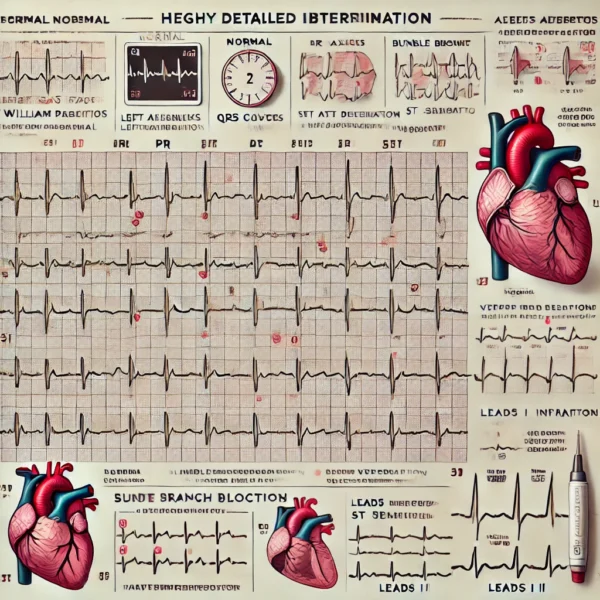
 First step in interpretation is determining rate and rhythm. For this the rhythm srtip is used, which is recording of lead 2. Heart rate is the number of beats occuring in one minute. ECG paper is run at a speed of 300 big squares in a minute. Look at QRS complexes and measure the number of big squares between two adjacent R waves. If 300 is divided by this distance, it gives the heart rate. If the beats do not occur at regular intervals, then heart rate is irregular, which could be regularly irregular or irregularly irregular. Normal ranges for heart beats is 60 to 100 per minute. If it is more than 100 it is termed tachycardia, and if it is less than 60 it is termed bradycardia. Heart beat begins in SA node with the P wave followed by QRS complex followed by the T wave. If all these waves are present, it is designated sinus rhythm. Sinus arrythmia is a normal variation influenced by breathing pattern.
Determine the axis by looking at leads 1 and 2. If both leads are positive (R >S), it is normal axis. If lead 1 is positive (R>S) and lead 2 is negative (R<S), it is left axis deviation, If lead 1 is negative (R<S) and lead 2 is positive (R>S), it is right axis deviation.
Next look at the P wave. It should be upright dome shaped and 3 small squares in width. Accepted variations are bifid P in mitral stenosis due to hypertrophy of left atrium and tall P in pulmonary hypertension due to hypertrophy of right atrium. Impulses may also originate from abnormal sites (ectopic) such as atrial wall, AV node or ventricular wall. Such instances will result in abnormal or absent P wave. P waves appear to quiver as in fibrillation or saw tooth like as in flutter. Next look at the PR interval the distence between beginning of P wave and beginning of QRS complex. It should be 3 to 5 small squares in width. If longer, it is a delay in conduction of impulse as in Ischaemic or rheumatic heart disease.
Next look at the QRS complexes as to their duration and morphology. Width of normal QRS is 3 small squares. If broader, it is due to bundle branch blocks, when ventricles do not depolarise together, or when ventricles are depolarised by an abherrant pathway in addition to the normal, as in Wolf-Parkinson-White syndrome. Morphology of QRS complex varies in different leads. It could be commonly found QRS deflections, single downward QS, single upward R, QR only, RS only or RSR1. As septal and early right ventricular activation is moving away from all the left sided leads, initial deflection will be negative in the form of Q, and as it is moving toward the right sided leads, initial deflection will be positive in the form of R, while leads at the bottom being at right angles to the vector will have small deflection or none. In apical activation of both ventricles, as it moves toward left side leads, a positive deflection in the form of R and as it moves away from right side leads, a negative deflection in the form of S will be recorded. In the final phase of unopposed ventricular depolarisation moving toward left leads, will display large positive R, while as it is moving away from right leads, it gives large negative deflection in the form of S. In the chest leads, as activity moves first toward right and away from left, V1 will have small R wave and V6 a small Q wave, and later as activity moves away from right and toward left, VI will have large S wave and V6 will have large R wave. Thus R wave progression is recorded in leads from V1 to V6.
Next look at the T wave. It should be upright dome shaped and 3 small squares in width. It is the most variable of the waves. In hyperkalaemia (high potassium) T wave is tall (tented), while in hypokalaemia (low potassium) it may be small, flat or absent with a U wave (late repolarisation of ventricles) following it. In heart attack, T wave is found inverted initially due to injury to heart muscle, but as ischemia wears off, it comes back to its original position. ST segment (line from end of S wave and beginning of T wave) is iso-electric. Look at ST for excess of 1mm of elevation (infarction) or depression (ischaemia). In heart attack, ST segment appears elevated initially due to injury to heart muscle, but as ischaemia wears off, it comes back to its original position. Saddle shaped ST is seen in pericarditis. Look at QT interval (between beginning of Q wave to end of T wave) which should be not more than 10 small squares. QT interval denotes the total time taken for ventricular activity. Prolonged QT interval could be caused by anti-arrythmic drugs or by electrolyte disturbances.
Look for conduction defects, which could be due to blocks at SA node, AV node or in the bundles. In SA block, there is normal sinus rhythm interrupted by absent P-QRS-T complex. AV blocks are three types. If PR interval is prolonged but constant, it is first degree heart block. There are two types of second degree block. In type 1 PR interval progressively lengthens, when one beat is missed for rhythm to start again (Wenckebach’s phenomenon). In type 2 ( Mobitz) P wave is regular and PR interval is constant but QRS-T is absent for every third P (2:1 block) or every fourth P (3:1 block). In complete AV block P and Q waves bear no relationship to each other, atria controlled by sinus or supraventricular focus and ventricles controlled by junctional focus or escape rhythm. For Bundle branch blocks, look at leads V1 and V6. If the shape of R-S-R complex is M in lead V1 and W in lead V6 (MaRRoW), it is right bundle branch block while if the shape of of R-S-R complex is W in lead V1 and M in lead V6 (WiLLiaM), it is left bundle branch block. In left anterior hemiblock there is left axis deviation with small Q wave in lead 1 and in left posterior hemiblock there is right axis deviation with small Q wave in lead 3. Combinations cause bifascicular and trifascicular blocks.
Look for rhythm abnormalities focussing on morphology and rate of occurrence of P waves and QRS complexes. Quivering P (‘F’) waves at 300 to 600 per min. with irregular ventricular response of morphologically normal QRS is atrial fibrillation. Saw tooth shaped P waves at 200 to 400 per min. with regular P-P interval and varying conduction (eg 4:1 or 2:1) with regular R-R interval and normal QRS complex is atrial flutter. In atrial tachycardia often occuring in paroxysms at 150 – 200 per min., P waves are of varying shapes with regular P-P cycles and normal QRS complexes. In junctional (nodal) tachycardia at 100 – 200 per min., P wave may be inverted or absent and QRS complex normal, but P will have no relationship to QRS (AV dissociation). Atrial and nodal rhythms are classed as supraventricular tachycardia. In ventricular tachycardia, QRS complex is wider and bizarre at 100 – 200 per min. P waves would be absent, but if present will have no relation to QRS (AV dissociation). In ventricular fibrillation there is no P wave or QRS complex with rate of 150 – 500 per min. Waves will be larger in coarse fibrillation and smaller in fine fibrillation.Ventricular premature contractions could be seen as single early (extrasystoles) or single late (escape beats) waves.


